- 29.04.2025.
- News, Management, Finances
In the yacht charter industry, where the season lasts only a few intense months, every decision leaves its mark. Pricing, fleet management, cost control – all of these are decisions that will either bring profit or cause losses, and there's no room for mistakes. If you don't have concrete numbers in front of you, decisions come down to a "feeling" or assumptions. Without KPIs (Key Performance Indicators), decision-making becomes relying on intuition – and intuition rarely beats analytics.
Running a yacht charter company in Croatia is not just about having good boats, reliable people, and long-standing connections with agents.
All of that still matters – but competition has grown. More fleets. But also more online channels. More guests who expect fast and clear service, without stress.
It’s not easy to stand out. But you’ll manage it more easily if you actually know what’s going on in your business.
And you’ll achieve that best by tracking KPIs (Key Performance Indicators).
You don’t have to be an analyst. You don’t even need expensive software.
It’s enough to track the right numbers, but regularly. Because those numbers show you where you’re losing, where you’re growing, and where the next opportunity might be.
KPIs that make sense for yacht charter
Theory is useful, but practice demands concrete numbers that show where you stand – and exactly where revenue is leaking.
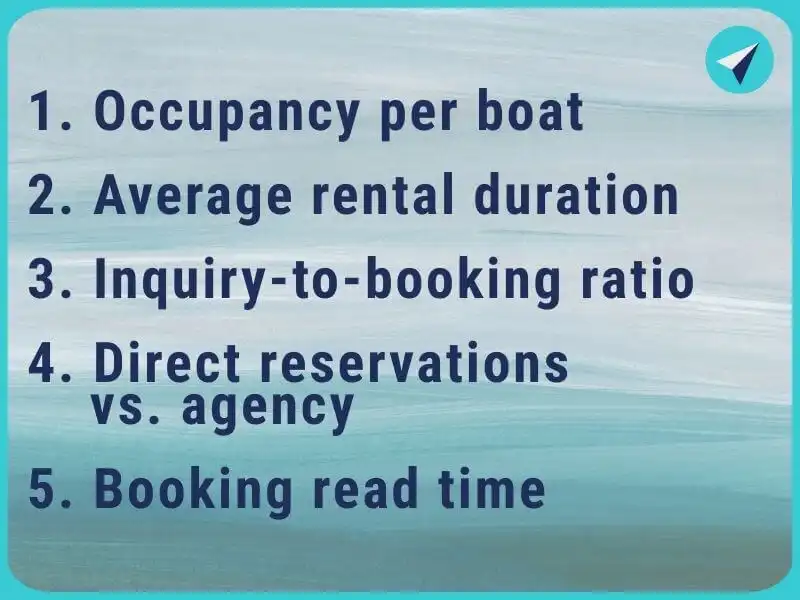
If you run a charter fleet, even a small one, these five indicators can help you work smarter, not just harder. Each of them can be tracked monthly or by season, and they’re generally easy to calculate from the data you already have.
1. Occupancy per boat (Booking rate)
This KPI shows how much your boat was actually booked during the available period. It often reveals hidden differences between boats that seem identical at first glance.
Formula:
(Number of days/weeks rented ÷ Total number of days/weeks available for rent) × 100
Example: If the boat was available for 20 weeks in the season and rented for 15 weeks:
(15 ÷ 20) × 100 = 75% occupancy
If one boat has significantly lower occupancy than the others, the problem might be in its listing, a bad review, unappealing photos, or even an outdated interior that no longer suits your guests’ profile.
2. Average charter duration
Average duration shows how many days a typical booking lasts. While weekly charters are still the standard, shorter or longer rentals are becoming more common – especially in the pre-season and post-season.
Formula:
Total number of rental days ÷ Total number of bookings
Example: If you had 18 bookings that covered a total of 108 days:
108 ÷ 18 = 6 days per booking on average
This figure directly affects planning: shorter rentals mean more turnarounds, more cleaning, more logistics. Longer rentals mean less stress for the base, but also a higher risk of last-minute cancellations.
3. Inquiry-to-booking ratio (Conversion rate)
It’s good to know how often inquiries turn into actual bookings. A high number of inquiries without bookings usually means that guests drop out somewhere in the process.
Formula:
(Number of confirmed bookings ÷ Number of inquiries received) × 100
Example: If 120 inquiries came in July and 30 bookings were made:
(30 ÷ 120) × 100 = 25% conversion
If that number is low, check response time, offer quality, clarity of information, and of course – price competitiveness.
4. Direct vs. agency bookings
This ratio shows your dependence on intermediaries, but also how much your website, social media, and personal sales are actually delivering.
Formula:
(Number of direct bookings ÷ Total number of bookings) × 100
Example: If you have 60 bookings, 18 of which are directly through your website:
(18 ÷ 60) × 100 = 30% direct bookings
By tracking this KPI, you can decide where to invest more – in agency relationships or in strengthening your own channels (website, newsletter, remarketing ads).
5. Booking lead time (time between reservation and charter start)
This figure shows how far in advance guests book boats. A longer lead time gives more room for planning, a shorter one means more stress – but also potential for last-minute offers.
Formula:
Average number of days between the booking date and the start of the charter
Example:
A booking made on April 1st for a charter starting July 1st = 91 days lead time
Add up all such gaps and divide by the number of bookings.
If the average lead time is decreasing each year, guests might be waiting until the last minute due to market conditions, flexible cancellation policies, or unreliable weather forecasts. It’s worth considering additional motivators for early bookings (e.g. smaller deposit, more flexible dates).
Why does all this make sense?
These indicators aren’t something to track if you have time left – they’re an operational tool.
They help you make decisions about scheduling, pricing, marketing, and investments – not based on gut feeling, but on data. You don’t have to track everything at once.
Start with the three you need most, set clear goals, and follow them month by month.
That way, instead of reacting to problems on the go, you’ll start systematically building control, stability – and better profitability.
What you can learn by tracking KPIs
Tracking KPIs is not an end in itself or just collecting numbers.
The real value comes when those numbers start revealing patterns - and while you still have time to react, not only after the season ends.
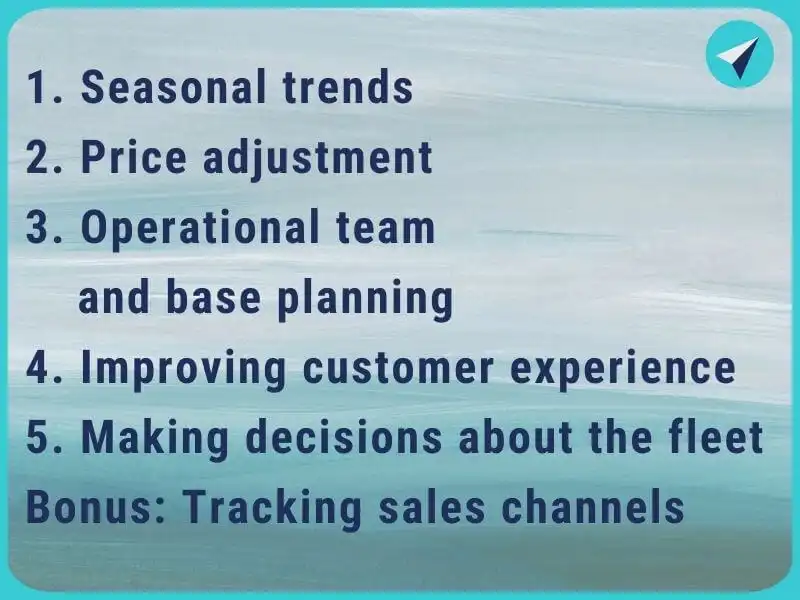
Here are a few areas where KPIs can help you make better decisions:
Seasonal trends
If you notice that, for example, May is getting booked faster year after year, it’s not a coincidence. It’s a sign that guests are increasingly looking for pre-season dates – perhaps due to lower prices, less crowding, or a better price-to-service ratio. It’s worth considering additional marketing activities for that month or introducing special offers.
Price adjustment
If certain weeks are consistently booked first (e.g. the second half of July), you may have undervalued them. If June is underperforming and you're treating it the same as a peak period, it’s time to adjust prices based on actual demand.
KPIs related to occupancy and rental duration allow for a more flexible pricing approach, instead of sticking to a fixed price list all season.
Operational team and base planning
If you know exactly how many days a rental lasts on average and how much time is needed between charters, you can organize boat prep, cleaning, and gear changes much more precisely. No unnecessary overlap or idle time in the schedule.
Data on the most common check-in and check-out days also helps you adjust staff working hours at the base and avoid bottlenecks.
Improving customer experience
A high number of inquiries with few bookings often means something is unclear, unattractive, or not convincing enough. If the response to an inquiry is delayed, the offer isn’t personalized, or the website images don’t reflect the boat’s true condition – guests turn to the competition.
KPIs related to inquiry conversion and the duration of the sales process reveal exactly where communication breaks down.
Making decisions about the fleet
If two boats of similar model and build year are getting completely different results – one regularly booked, the other idle most of the season – it’s not a coincidence. That difference gives you a concrete clue about what the market really wants. Size, cabin layout, number of bathrooms, and even extra equipment can play a decisive role.
This type of comparison can help you steer your next investment wisely – toward a boat that will bring a better return on investment.
Bonus: Tracking sales channels
Through KPIs, you can easily see where most bookings come from – whether it's a booking platform, agency, your own website, or social media.
If one channel brings a lot of inquiries but has poor conversion, it’s worth re-evaluating.
If another channel generates fewer inquiries but has high conversion and greater spending per guest – that’s the channel worth developing.

Tools that can help you
Tracking KPIs doesn’t mean you have to manage everything in Excel spreadsheets.
There are digital tools that help track sales, communication, guest behavior, and fleet performance – with much less effort and greater clarity.
Here are a few solutions that can help you make the numbers really work for you:
Google Looker Studio
If you use various data sources – for example, web analytics, reservation system data, social media, or CRM – Looker Studio allows you to consolidate them in one place. You can create your own KPI dashboard that automatically pulls data from Google Analytics, Google Sheets, Facebook Business Suite, and other sources. This is especially useful for tracking month-to-month trends, such as traffic sources, conversion rates, and seasonal fluctuations in interest.
HubSpot CRM or Zoho CRM
These tools help track guest relationships – from the first inquiry to repeat bookings. You can see how quickly inquiries are answered, who sent the offer, how many times the same guest was contacted, and how much revenue your “most loyal” clients generate. It’s also easy to spot which team member closes the most bookings and where the most potential opportunities are lost.
Power BI (Microsoft)
If you want deeper data analysis and have data stored in different databases or spreadsheets, Power BI allows for advanced processing and visualization. It’s an ideal solution for companies that want reports by fleet, base, or even agent. You can set up an automated report and give each team member access to the data relevant to them.
Airtable
For smaller fleets or companies that want more flexibility, Airtable is a good and more functional alternative to Excel. You can create your own databases that include all bookings, statuses, prices, contact information, occupancy per vessel, and much more, with options for automatic alerts and filtering by KPI criteria.
Supermetrics
This tool is especially useful if you work in performance marketing (e.g. Google Ads, Meta Ads) and want to consolidate all marketing metrics in one document. Supermetrics connects with Google Sheets, Excel, or Looker Studio and automatically imports data on clicks, impressions, cost per booking, and much more. This way, you can precisely track the ROI of each campaign and compare it to the actual number of confirmed bookings.
You don’t need all the tools at once. Start simple: ask concrete questions (e.g. “How quickly do we respond to inquiries?”, “Which boat gets rented the least?”), choose a tool that can give a clear answer to that, and track the data regularly. Very quickly, patterns and trends will emerge that can lead you to better decisions - and better results.

Long-term value of KPIs
Most yacht charter companies look at the number of bookings and total revenue. And that’s fine.
But those that track more than that – that measure, analyze, and respond – have more stable growth and fewer surprises.
Why? Because they detect revenue loss earlier. Because they spot what works faster. And because they don’t wait until the end of the season to make changes.
If you want concrete numbers that will help you make better business decisions, get in touch for an individual review and suggestions on what you could track in your own business.
Start tracking what truly helps you keep sailing forward – with a full fleet and a clear goal.

Čarter.hr – the place where nautical professionals find concrete answers. Do the same – sign up for our weekly newsletter.

Categories of trends
- News
- Sale
- Marketing
- SEO
- Web design
- Social media
- Technology
- Regulations
- Management
- Education
- Finances
- User experience
- Graphic design
Newsletter
Sign up for the newsletter and receive the latest trends and tips straight to your inbox